


http://tecdat.cn/?p=10080
Theil-Sen估计器是一种在社会科学中不常用 的简单线性回归估计器 。三个步骤:
在数据中所有点之间绘制一条线
计算每条线的斜率
中位数斜率是 回归斜率
用这种方法计算斜率非常可靠。当误差呈正态分布且没有异常值时,斜率与OLS非常相似。
有几种获取截距的方法。如果 关心回归中的截距,那么知道 软件在做什么是很合理的。
当我对异常值和异方差性有担忧时,请在上方针对Theil-Sen进行简单线性回归的评论 。
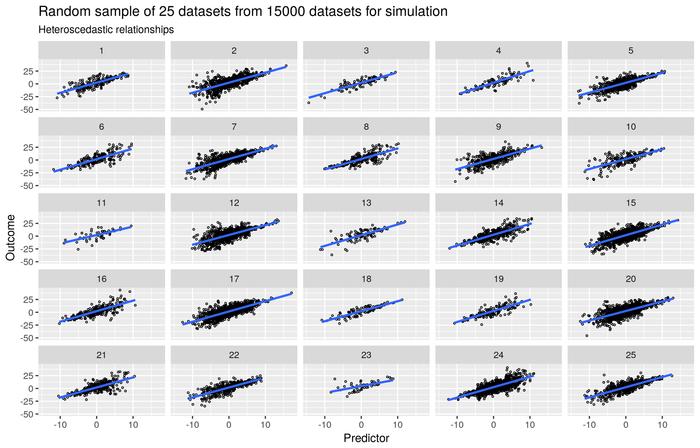
我进行了一次
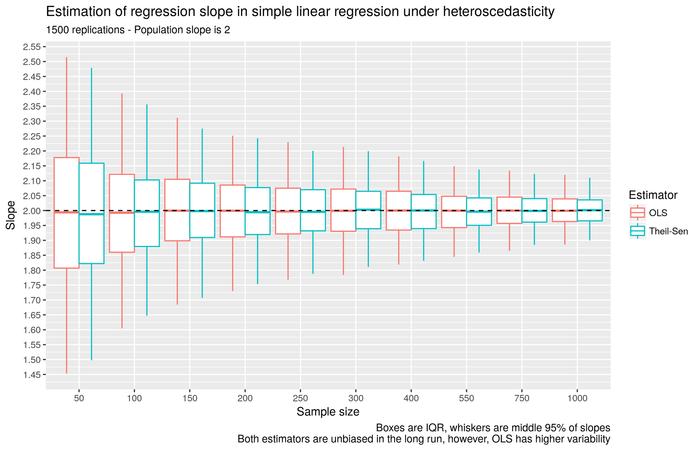
模拟,以了解Theil-Sen如何在异方差下与OLS比较。它是更有效的估计器。
geom_boxplot(\n
aes(ymin = q025, lower = q25, middle = q50, upper = q75, ymax = q975), data = summarise(\n
group_by(coefs.0, n, Estimator), q025 = quantile(Slope, .025),\n
q25 = quantile(Slope, .25), q50 = quantile(Slope, .5),\n
q75 = quantile(Slope, .75), q975 = quantile(Slope, .975)), stat = \"identity\") +\n
geom_hline(yintercept = 2, linetype = 2) + scale_y_continuous(breaks = seq(1, 3, .05)) +\n
labs(x = \"Sample size\", y = \"Slope\",\n
title = \"Estimation of regression slope in simple linear regression under heteroscedasticity\",\n
subtitle = \"1500 replications - Population slope is 2\",\n
caption = paste(\n
\"Boxes are IQR, whiskers are middle 95% of slopes\",\n
\"Both estimators are unbiased in the long run, however, OLS has higher variability\",\n
sep = \"\\n\"\n
))\n\n\n\n"}" style="">ggplot(coefs.0, aes(x = n, colour = Estimator)) + geom_boxplot( aes(ymin = q025, lower = q25, middle = q50, upper = q75, ymax = q975), data = summarise( group_by(coefs.0, n, Estimator), q025 = quantile(Slope, .025), q25 = quantile(Slope, .25), q50 = quantile(Slope, .5), q75 = quantile(Slope, .75), q975 = quantile(Slope, .975)), stat = "identity") + geom_hline(yintercept = 2, linetype = 2) + scale_y_continuous(breaks = seq(1, 3, .05)) + labs(x = "Sample size", y = "Slope", title = "Estimation of regression slope in simple linear regression under heteroscedasticity", subtitle = "1500 replications - Population slope is 2", caption = paste( "Boxes are IQR, whiskers are middle 95% of slopes", "Both estimators are unbiased in the long run, however, OLS has higher variability", sep = "\n" ))
发布于:浙江


举报成功